IB Physics IA: best practices to boost your grade

The IB Physics IA is a substantial part of your IB Physics assessment. Nail it, and one-fifth of your final score will be in the bag. But, as always, it’s easier said than done. Every year, thousands of IB students wonder how to choose a standout idea and transform it into an IA that grabs top marks.
Luckily, you’ve found our Physics IA guide, which explains in detail how to boost your scientific exploration. Whether you’re searching for inspiration or refining your existing project, these best practices can make all the difference.
Need help with IB Physics?


Why is Physics IA so important for your final grade?
The Physics Internal Assessment is one of the assessment elements of the entire course. Whether you’re taking Standard or Higher Level, it makes up 20% of your final grade in IB Physics.
However, when we talk about the role of the Internal Assessment, we should look at the whole picture, not just the examination. In the grand scheme of things, it can help you:
- Improve your research skills (you will have to carefully choose your topic, plan an experiment, gather data, and so on);
- Further develop your critical thinking (you need to analyse what your data means, ask questions, test ideas, and back up your conclusions with evidence);
- Boost your communication skills (particularly, explain your findings in a clear way, organise your thoughts, capture the reader’s attention, etc.);
- Explore your creative freedom (you get to choose your topic, research question, and methodology);
- Transfer theory into practice and see how Physics work in real life;
- Explore a topic you feel a personal connection with.
Overall, Internal Assessment provides an opportunity to improve your skills all around – you will end up with stronger research skills, sharper thinking, and better ways to express yourself. Plus, you can learn more about the Physics manifestation in the world around you.
How to score high on Physics IA with a quality report
You will document your entire IB Physics IA journey in a 3,000-word report and submit it to your teacher for review. The maximum you can receive is 24 marks, but how exactly do you achieve them? We’ll explain everything below.
1. Understand the criteria to meet the examiners’ expectations
Before you even start working on your investigation, it is important to understand what examiners are looking for. The IA marking criteria serve as your roadmap throughout the process and focus on different aspects of your final submission:
Research Design (6 Marks). This criterion evaluates the clarity of your research question and the coherence of your methodology. Your research question should be precisely defined and feasible, with a clear justification for every step you take to investigate it.
Data Analysis (6 Marks). Focused on data, this criterion assesses how effectively you record, process, and present it. You should organise information in a manner that directly addresses your research question. You are allowed to use charts, graphs, statistical tools, etc., as a way to enhance the clarity of your findings.
Conclusion (6 Marks). The conclusion is where you tie everything together and provide a direct answer to your research question. It should flow naturally from your data and incorporate relevant scientific theory.
Evaluation (6 Marks). This criterion showcases your ability to critically analyse your methodology and propose meaningful improvements. To earn full marks, you must discuss the sources of your errors, limitations of your approach, potential biases, etc. At the same time, you need to suggest realistic recommendations for improvement. This way, you show examiners that you are able to learn from the process.
2. Design a controlled and focused experiment
Many students believe that they need a lab packed with cutting-edge equipment to create a high-scoring IB Physics IA. While it is true to some extent – you do need some equipment – it doesn’t have to be complex or expensive. The purpose of the Internal Assessment is not to introduce you to lab setups. Rather, it challenges you to create a scientifically sound investigation achievable with what you have at hand.

Most students opt for practical experiments to demonstrate their ability to apply theoretical concepts to practical situations. However, you can choose an alternative path and use simulation software instead. Clearly, both methods have their pros and cons:
Traditional Experimentation:
- Provides deeper conceptual understanding through hands-on application;
- Includes more variability due to external factors;
- Helps you demonstrate practical scientific skills (such as creation of an experimental setup, observation, data collection, etc.);
- Leaves more room for errors.
Simulation Software:
- Generates more precise data;
- Enables investigation of more complex topics;
- Simplifies data collection and recording.
Despite the precision advantages of simulations, they can potentially limit room for evaluation. Since simulators reduce errors and uncertainties, you might find it challenging to discuss methodological improvements. After all, the acknowledgement of your mistakes and limitations, as well as suggesting ways to refine your approach, are the requirements of the Evaluation criterion.
For this reason, the experimental approach, despite the fact that it is prone to errors, provides rich material for analysis and reflection. It is actually a must that you specify which difficulties you faced and how you tried to overcome them (for instance, you used more precise measurement instruments or redesigned your methodology).
Regardless of your chosen method, your goal is to develop a detailed experimental design that clearly identifies variables, control groups, and necessary equipment. You also need to provide a full list of equipment pieces and specify their accuracy. When you discuss the purpose of these tools and how you used them, you may also include a photograph or a diagram of your setup for better clarity.
Last but definitely not least, you need to keep safety considerations in mind when planning your investigation.
3. Collect accurate data
In your experiment, you will need to manage three types of variables. Let’s say you are investigating the relationship between the angle of launch and the range of a projectile. In this case, your variables are going to be:
- Independent Variable – the factor you intentionally change during your experiment – is the angle of the launch;
- Dependent Variable – the outcome that changes in response to the independent variable – is the distance the projectile travels horizontally before landing. The measured independent and dependent variables will constitute your raw data.
- Control Variables – these are the factors that must remain constant to ensure test validity. In this experiment, control variables may include a launch speed, air resistance, the shape and mass of a projectile, wind force, etc.
After you consider all your variables, you need to create a plan for measuring and controlling them. Your goal here is to maximise precision and minimise measurement errors. So, before you select your equipment and decide how to use it, you need to ask yourself these questions:
- Which measuring apparatus provides the appropriate level of precision?
- Is there a way to improve measurement precision?
- What sources of human error might affect my results?
- What strategies will minimise these errors?
- Can I repeat measurements to reduce random errors?
- Are there limitations to my data range?
- How might limited data affect my conclusions?
One more thing to think about – how are you going to organise your data after you’ve collected it? We recommend tables with a clear format. They will help an examiner understand the numerical results of your experiment and make it easier for you to analyse the raw data. You can use whatever table format makes sense for your investigation as long as it facilitates comparison between different data sets and displays multiple variables effectively.
4. Analyse results using appropriate methods and graphs
After collecting your raw data, you must transform it into meaningful insights that address your research question. Patterns, trends, relationships – all of these can provide the explanation of the physical phenomenon you’re exploring.
Depending on your investigation, you might use t-tests, regression analysis, chi-square tests, and other methods to verify the significance of your results.
When processing your data, don’t forget to provide an example calculation. Choose a data sample, and walk the reader through the calculation step by step. This detailed breakdown should show:
- The specific equation you applied;
- Raw data that you used;
- Each mathematical step that led to your final result;
- Units and significant figures at each stage.
After you’ve processed your data, put the results in a well-organised table. At the same time, to illustrate your findings and thus enhance the impact of your analysis, you can create graphs. Particular types of graphs will depend on the relationships you observe – scatter plots for correlation studies, line graphs for continuous relationships, bar charts for categorical comparisons, and so on. Still, each graph that you present should feature:
- Axis labels with units;
- An informative title that conveys the relationship;
- Best-fit lines for data with linear relationships;
- A comprehensive figure legend explaining any symbols or notations;
- If appropriate, error bars.
While your raw data manipulations and the visual representation of processed data are important, its detailed analysis is what really matters. That’s why you need to discuss the features of your graphs (such as slopes, intercepts, or data clustering) that reveal physical relationships. Address whether your trend line passes through the origin and whether this aligns with theoretical expectations. If there are any outliers, you need to point them out and evaluate whether they represent experimental anomalies or significant discoveries.

Remember that graphs serve as visual evidence for your conclusions. Every trend, pattern, or anomaly you identify should connect directly to your research question and hypothesis.
5. Organise a clear and structured IA report
Although examiners assess your experimental and analytical abilities, the presentation of your report can impact their overall impression. Even if you managed to conduct a brilliant investigation, you will not receive full marks for a poorly constructed and disjointed report. The best approach to its structure is a logical progression that reflects your scientific method.
While the exact format may slightly vary based on your specific investigation, the following appears to be the most effective:
Report Details
Firstly, the title of your work should follow the format of “An Investigation into the Effect of X on Y.” Along with this, you need to provide a specific research question focusing on the relationship between clearly defined variables.
Introduction
In this short (around 150 words) section, you provide a succinct context for your investigation. In particular, you need to explain why your research question matters scientifically (global significance) and personally (personal engagement).
Theoretical Foundation
Next, you should explain which scientific principles underpin your investigation. You can include relevant physical concepts, mathematical models, and equations that form the basis of your research. At the same time, you state your hypothesis, i.e. a specific prediction about the relationship between your variables based on scientific principles.
Variables
Here, you provide an overview of your independent, dependent, and control variables, as well as clarify their roles in your investigation.
Methodology
First of all, you need to include an equipment list specifying the apparatus you used with measurement uncertainties. For more clarity, you may provide labelled diagrams or photographs of your experimental setup.
Second, explain step-by-step your procedure. This description should be detailed enough that another researcher could replicate your work.
Need help with this subject?
100 % of tutors are certified teachers and examiners
Raw Data
This section features the data you’ve collected, organised in labelled tables. Besides quantitative data, you should also specify qualitative data, where applicable.
Processed Data
In this section, you present manipulated data alongside calculated uncertainties and averages. Along with this, you can present your findings with appropriate graphs – they must be fully labelled and annotated.
Analysis and Conclusion
The focus of this section is an interpretation of your results and addressing your research question. Examiners assess how well you were able to connect your findings to your original hypothesis and relevant scientific theories. Additionally, you should compare your results with established values and explain any discrepancies.
Evaluation
Here, you critically assess your methodology and results. You need to identify specific sources of error (random, systematic, or human) and evaluate their impact on your findings. After this, propose improvements to your experimental design and explain how these would enhance the quality of your results.
References
Include a properly formatted bibliography of all sources cited in your report.
Remember that your complete report must not exceed 3,000 words. The following elements don’t count toward this limit: charts, data tables, equations, citations, bibliography, and headers.
6. Identify errors and suggest improvements
Every physics experiment involves some degree of error. Just the fact that errors and inaccuracies occurred shouldn’t impact your grade. What truly matters is your ability to be upfront about these errors, explaining their sources, and suggesting ways to avoid them.
The evaluation section of your IB Physics IA offers an opportunity to showcase your understanding of experimental weaknesses and your ability to propose improvements.
When analysing experimental errors, it’s important to distinguish between different types:
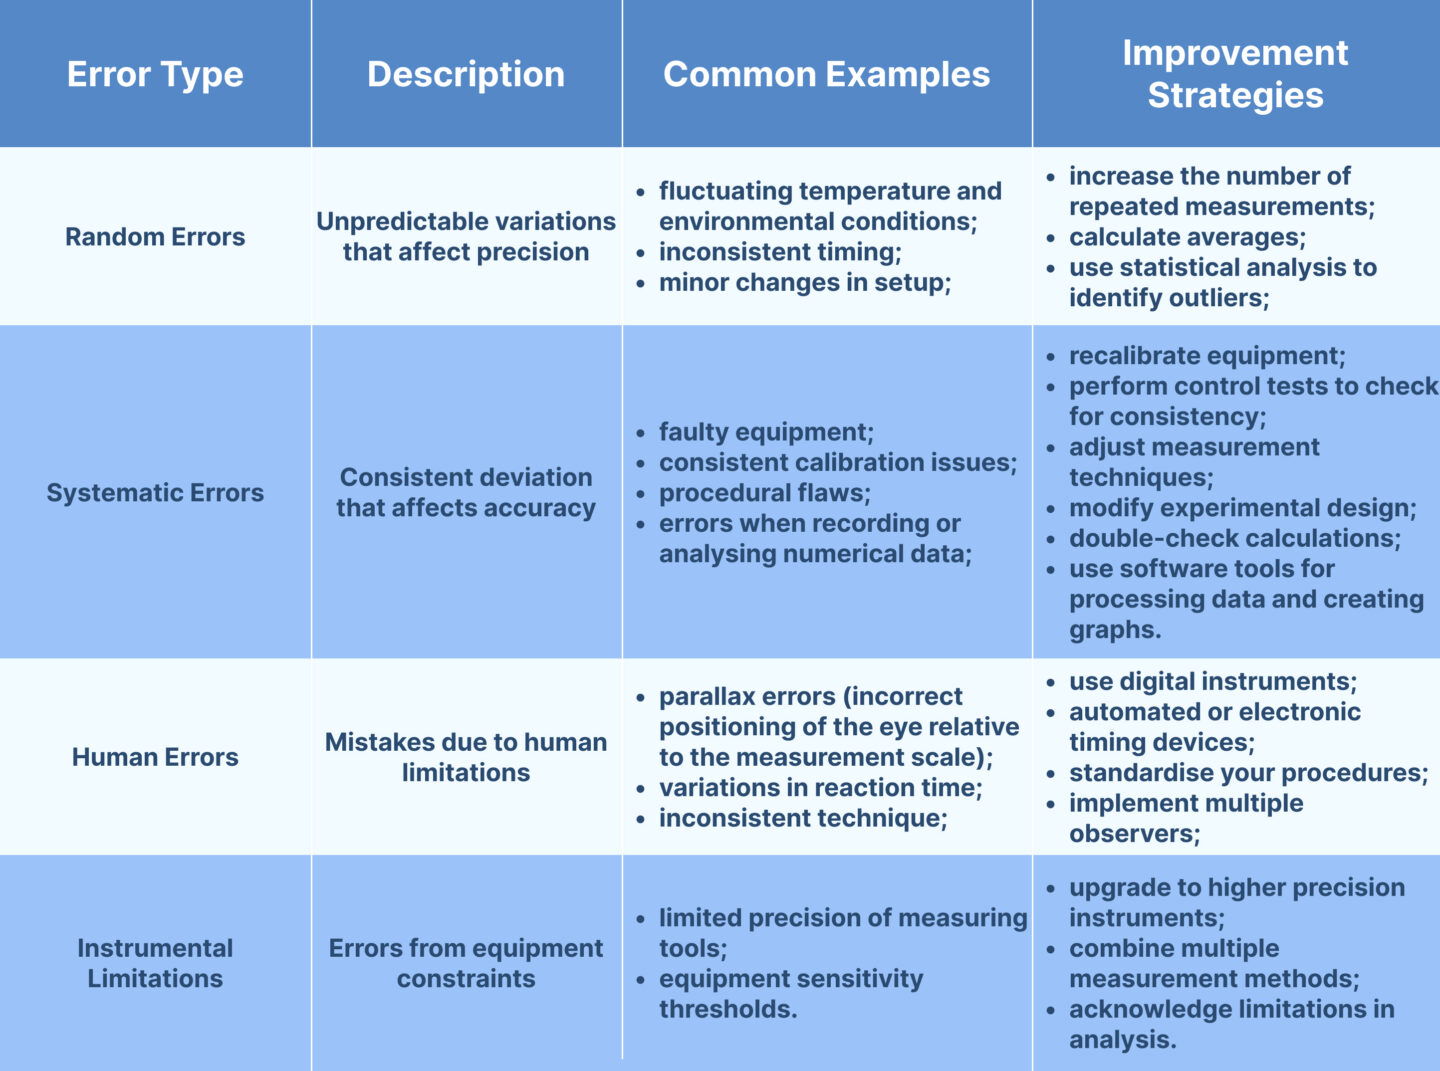
When evaluating your results, it is not enough to specify your errors. Ideally, you also need to explain their impact on your results. For each significant error source, consider:
- How it affected your dependent variables;
- Whether it caused systematic overestimation or underestimation;
- How it might have influenced your conclusion.
When it comes to improvements, they may include specific modifications to the experimental design, alternative measurement techniques, or additional control measures. Please keep in mind that you need to explain how these changes address specific weaknesses in your scientific investigation and improve result quality.
7. Use original ideas to avoid plagiarism
Coming up with a unique idea for your IB Physics IA is one of the biggest challenges. On the one hand, you need to consider your limitations and stick to the experiments you can conduct with the available time and resources. On the other hand, you want to be original and avoid surface-level topics that have been extensively researched.
Having said that, there is always a way to find an element of originality even in common topics. Here are some approaches to make hackneyed topics more distinctive:
- Apply well-understood principles to unconventional contexts or real-world problems;
- Develop unique experimental setups or measurement techniques;
- Investigate relationships between variables not typically studied together;
- Explore topics that combine two branches of Physics or even two disciplines, such as Physics and Chemistry.
Should you use IB Physics IA ideas found on the internet? Yes and no. If you choose a topic just because it is doable, it is likely that your teacher has already seen it. On top of that, it might be hard to explain its personal significance. Still, these ideas might serve as inspiration and spark your creativity. You just need to add your personal spin and make these ideas truly yours.
How to present your Physics IA for a higher mark
Next, we’ll discuss other elements able to contribute to a higher mark for your IB Physics Internal Assessment.
1. Pick a topic you’re passionate about
Previously, personal engagement was one of the Physics IA assessment criteria. Although today the focus has shifted towards reflection and evaluation, it is still worth it to provide a context for your experiment.
As we have already pointed out, your investigation should be manageable within your limitations (time constraints, available equipment, and so on). Still, the best Physics IA topic is one that you personally find interesting. Your enthusiasm about it might help sustain you through challenges and likely result in a deeper analysis and commitment. As a starting point, you may consider connections to your hobbies, career aspirations, or curiosities about everyday phenomena.
One more approach to choosing your topic comes from the IB programme itself and its focus on global awareness and world issues. In other words, you are able to add more depth and relevance to your IB Physics investigation by connecting it to modern challenges. You can, for example, explore renewable energy technologies, efficiency improvements, sustainability solutions, etc.
These connections don’t have to be complex. Even simple investigations can establish meaningful links to larger issues. For instance, a study of friction forces might connect to energy efficiency in transportation systems, or an investigation of fluid dynamics could relate to water conservation technologies.
2. Formulate a testable hypothesis
A well-crafted hypothesis forms the foundation of your IB Physics IA. In a sense, it is a bridge between your theoretical understanding and experimental investigation. Unlike a general research question, your hypothesis presents a specific, testable prediction about the relationship between variables.
The most effective hypotheses in Physics IAs follow an “if-then” structure, such as “If the angle of incidence increases, then the intensity of reflected light will decrease according to the inverse square law.”
This hypothesis specifies exactly what you expect to observe when manipulating your independent variable (angle of incidence) and why this should occur (based on the inverse square law).
When working on your hypothesis, you need to keep in mind that it must be:
- Specific and measurable. Avoid vague terms like “significant effect” or “better performance”. Instead, use specific, science-based outcomes such as “Y will increase proportionally” or “Y will double.”
- Theoretically grounded, i.e. based on the established physical laws or principles.
- Reasonably attainable – you need to be able to test it with available equipment and within practical constraints.
A common question among students is whether experimental results must confirm their hypothesis to achieve a high score. The answer is no. In fact, results that contradict your hypothesis often lead to insightful discussions and evaluations.
3. Use clear tables and graphs
Tables and graphs play a critical role in presenting your findings, even though they are not explicitly required by the assessment criteria. Their task is to organise your data and guide the reader through your investigation.
Typically, IB Physics IAs include two tables:
- Raw data table featuring independent and dependent variables, and, if necessary, qualitative data.
- Processed data representing your scientific insights.
For both types of tables, you need to provide a descriptive title indicating what these data represent. All the columns must be fully labelled and provide appropriate units. Don’t forget about consistency in significant figures, i.e. the same position of the decimal point. Besides, it may be beneficial to provide a notation of qualitative observations or anomalies in your raw data table, along with calculated uncertainties and average indicators for processed data.
Graphs are one more effective way to represent your findings. They help visualise data and transform numbers into interpretable patterns. Regardless of the type of graph that best works for your findings, it should have a descriptive title stating the relationship it illustrates, labelled axes with appropriate units, data points, and a legend explaining multiple data series if present.
Keep in mind that tables and graphs alone won’t allow you to get full marks. It is a must to interpret what they reveal. Below each graph, include an analysis that addresses:
- The general trend or pattern (linear, exponential, periodic, etc.);
- The mathematical relationship between variables, including relevant equations;
- Whether the trend aligns with your hypothesis and theoretical expectations;
- The significance of specific features such as slope, intercept, or asymptotes;
- Any outliers or anomalies and their possible explanations;
- The degree of scatter or deviation and what it suggests about experimental reliability.
4. Reflect on experiment limitations
As we have already pointed out, reflecting on the limitations of your experiment is one of the requirements to get valuable marks (specifically, for the Evaluation). You shouldn’t, however, think of it as nitpicking. Reflection is, in fact, part of the scientific process and incorporating it into your work shows that you understand it. After all, no experiment is perfect. So, pointing out its weaknesses proves you can think critically about what you’ve done.
These limitations are often related to access to equipment or less-than-ideal external factors. The most common of them include:
- Measurement precision due to access only to basic measuring tools;
- Environmental factors, including room temperature, humidity, atmospheric pressure, wind, etc., i.e. dissimilar conditions for different trials;
- A limited sample size or doing just a few trials might not give you the full story;
- Skipping factors like friction or air resistance to simplify math might make your results less realistic;
- Short lab sessions may stop you from doing enough repeats or testing more conditions;
- Relying on secondary data because of the complexity of the topic or safety hazards.
After you’ve identified your limitations, you need to explain how they might have changed the results. Did they make them less precise? Or did they make you change/adapt your methodology?
Finally, you need to come up with ways to eliminate them or reduce their impact. You may, for instance, suggest better equipment, tweak your setup, or add more trials. However, try to make these improvements more practical, like the ones you could actually make in a school lab. So, a suggestion to ‘get a quantum computer’ is hardly realistic. On the other hand, a digital timer with a millisecond accuracy to replace a stopwatch could be a sensible and readily available upgrade.
Find a tutor to add creativity to Physics IA and get a top grade
While the IB Physics IA marking criteria don’t explicitly demand “creativity”, it is implied between the lines. Examiners who have seen countless submissions can easily spot overused topics and well-trodden paths. Unless you can bring a fresh perspective to common ideas, it’s often better to avoid them altogether. But with so many criteria and limitations, how do you even write an Internal Assessment that scores high?
At TutorsPlus, we have an answer. Our IB Physics tutors are experienced teachers and examiners who know the exact dos and don’ts for an exceptional Internal Assessment. From brainstorming novel ideas to perfecting your analysis and presentation, you can rely on their expertise.
We are available at +41 22 731 8148 and if you’re ready to infuse your IB Physics IA with the originality that earns top marks.
By Sara Lloyd
Sara has been an education consultant for TutorsPlus for 15 years, and is an expert on international IB education. She is also a parent of two lively children.